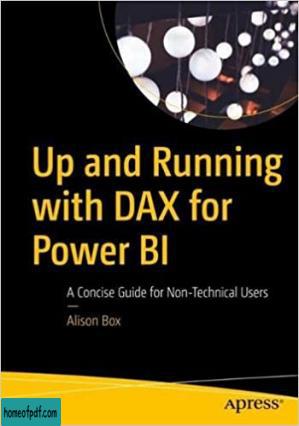
Up and Running on DAX for Power BI: A Concise Guide for Non-Technical Users 电子书下载
Take a concise approach to learning how DAX, the function language of Power BI and PowerPivot, works. This book focuses on explaining the core concepts of DAX so that ordinary folks can gain the skills required to tackle complex data analysis problems. But make no mistake, this is in no way an introductory book on DAX. A number of the topics you will learn, such as the concepts of context transition and table expansion, are considered advanced and challenging areas of DAX. While there are numerous resources on DAX, most are written with developers in mind, making learning DAX appear an overwhelming challenge, especially for those who are coming from an Excel background or with limited coding experience. The reality is, to hit the ground running with DAX, it’s not necessary to wade through copious pages on rarified DAX functions and the technical aspects of the language. There are just a few mandatory concepts that must be fully understood before DAX can be mastered. Knowledge of everything else in DAX is built on top of these mandatory aspects. Author Alison Box has been teaching and working with DAX for over eight years, starting with DAX for PowerPivot, the Excel add-in, before moving into the Power BI platform. The guide you hold in your hands is an outcome of these years of experience explaining difficult concepts in a way that people can understand. Over the years she has refined her approach, distilling down the truth of DAX which is “you can take people through as many functions as you like, but it’s to no avail if they don’t truly understand how it all works.” You will learn to use DAX to gain powerful insights into your data by generating complex and challenging business intelligence calculations including, but not limited to: Calculations to control the filtering of information to gain better insight into the data that matters to you Calculations across dates such as comparing data for the same period last year or the previous period Finding rolling averages and rolling totals Comparing data against targets and KPIs or against average and maximum values Using basket analysis, such as “of customers who bought product X who also bought product Y” Using “what if” analysis and scenarios Finding “like for like” sales Dynamically showing TopN/BottomN percent of customers or products by sales Finding new and returning customers or sales regions in each month or each year Who This Book Is For Excel users and non-technical users of varying levels of ability or anyone who wants to learn DAX for Power BI but lacks the confidence to do so
尊敬的读者:
欢迎您访问我们的网站。本站的初衷是为大家提供一个共享学习资料、交换知识的平台。每位用户都可以将文件上传至网盘并分享。
然而,随着用户上传的资料增多,我们发现部分不宜或版权问题的书籍被分享到了本站。
为此,我们已经关闭了分享入口,并进行了多次书籍审查,但仍有部分内容未能彻底审查到位。
在此,我们恳请广大读者与我们共同监督,如发现任何不宜内容,请 点击此处 进行举报,我们会第一时间处理并下架相关内容。
希望我们能共建一个文明社区!感谢您的理解与支持!
猜你喜欢
- Deep Learning with TensorFlow and Keras 3rd Edition - Amita Kapoor, Antonio Gulli and Sujit Pal 电子书下载
- 《瑜伽气功与冥想(21年畅销·纪念限量珍藏本)》 柏忠言 电子书下载
- 《中公版·(2020)国家公务员录用考试轻松学系列:申论的本质》 电子书下载
- 《幸福的婚姻》约翰?戈特曼金牌编剧王海鸰鼎力推荐西雅图爱情实验室的心理学报告文字版 电子书下载
- 《一个数学家的叹息》保罗·洛克哈特 电子书下载
- 《明清之际士大夫研究》赵园文字版 电子书下载
- 《在新疆》刘亮程 电子书下载
- 《炒股的智慧:在华尔街炒股为生的体验》陈江挺经典版 电子书下载
- 《论语全鉴(珍藏版)》[春秋]孔丘 电子书下载
- 《笑聊股市》每文经典版 电子书下载
- Swift Programming: The Big Nerd Ranch Guide - Mikey Ward 电子书下载
- 《蒙田随笔》蒙田 电子书下载


